Updated Florida Digital Atlas for The New Map of Empire released

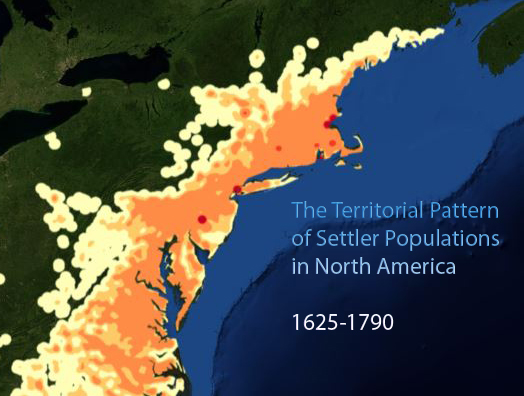
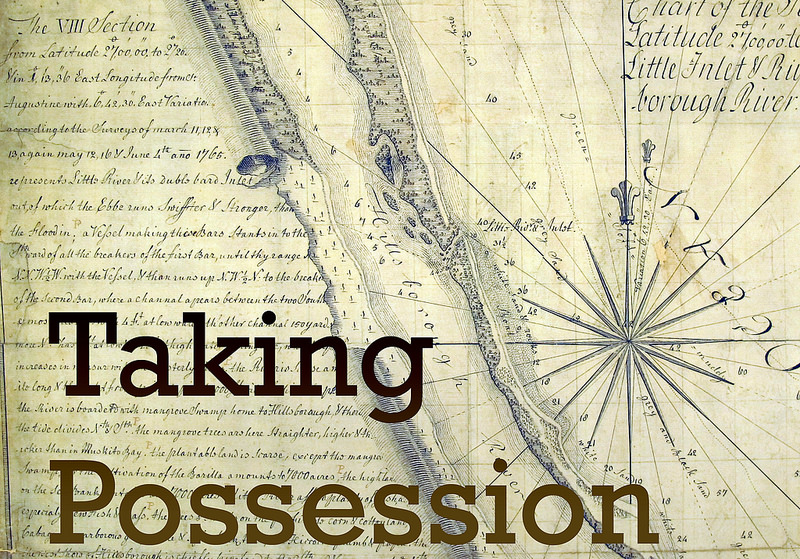
Today I completed and published an updated digital atlas for chapter six, “Defining East Florida.”  Like all atlases for the book, they can be found at the New Map of Empire atlas page. The atlas features maps of peninsular Florida before and after the Peace of Paris, the 1763 treaty that granted this Spanish province to Great Britain.  It examines how the British tried to take command of the province to colonize it.  East Florida was distinctive in this process of taking possession of new territories because it was–by a long shot–the least understood place Britain acquired.  The first part of the atlas documents how mapmakers came to see the peninsula as a collection of islands instead of a part of the mainland.  Literary scholar Michelle Navakas (English, Miami University) first identified this geographic idea and discusses it in greater length in her new book, Liquid Landscape: Geography and Settlement at the Edge of Early America (University of Pennsylvania Press, 2017).

The British put Florida back together again, seeking to describe a province better suited for plantation development.  Surveyor General William De Brahm charted its coastline extensively in the 1760s, documenting river inlets that promised to become vectors for settlement.  He came to believe, however, that southern Florida was so volatile as a natural place that it would be difficult for Britain to colonize effectively in the short term.  His scientific views brought him into conflict with East Florida Governor James Grant, who was bent on his colony’s rapid development by metropolitan planters.


“Touch History” project uses MapScholar to explore the cartographic record of Quebec City

Scholar Louis-Pascal Rousseau is developing a visual exhibit of the maps, views, and key historic places of Quebec City.  He’s become an early adopter of MapScholar and has posted a few YouTube videos (in French) describing his vision for the site and the ways in which MapScholar can be tailored to a range of different projects.  Currently in the second year of a three-year NEH Digital Implementation grant, we are working with a number of partners to display maps and geospatial images about subjects as diverse as the neighborhoods of modern Los Angeles and the early plantation society of the Danish island of St. Croix.  We welcome new strategic partnerships at this stage:  they help us stretch the capacities of MapScholar to uses we didn’t anticipate.  We’ll provide the instruction and support to teach you how to program a MapScholar site; you provide some time and effort to learn the resource and how to curate your images and data within it.


New article in the JMGL


The Journal of Map & Geography Libraries: Advances in Geospatial Information, Collections & Archives has published a new article about MapScholar.  Written by MapScholar developers S. Max Edelson and Bill Ferster, “MapScholar: A Web Tool for Publishing Interactive Cartographic Collections” describes the origins of the project and especially its relevance for the new “spatial turn” in humanities research.

Abstract: MapScholar is an open-source Web tool that encourages humanities researchers to gather, analyze, and share images of historical maps. It is designed to open access to map images, visualize maps as collections within rich geospatial contexts, and enhance traditional publishing by making it easy to produce interactive, high-resolution map displays. Despite its enormous potential, map history has always been limited by the challenges of reproducing dense images printed and drawn on fragile paper artifacts. MapScholar capitalizes on the increasing availability of digital images to foster breakthroughs in map analysis and interpretation. By enabling any scholar to create an interactive digital map collection that can be “published” to illustrate a book or article, this new digital humanities tool seeks to put maps at the center of the new spatial turn in the humanities.

Library of Congress lecture first to feature MapScholar

University of Virginia history professor S. Max Edelson presented a collection of maps of the North American Indian boundary to illustrate a lecture to the Washington Map Society on March 28, 2013.  This first public demonstration of the redesigned “MapScholar 2.0” showcased the three-dimensional navigational tools of Google Earth as well as a variety of kml overlays that highlighted map details and put them into context.  To show the collection of published and manuscript maps of the North American frontier in the 1750s, 1760s, and 1770s, Edelson programmed a series of views of the maps that he advanced, in Powerpoint fashion, with a remote control “clicker.”